
VPN testing guide + local calculator
VPN Speed Test & Speed-Loss Calculator
Enter a no-VPN baseline and a VPN-connected result to calculate download and upload loss or gain, speed retention, and latency changes. Then use the testing guide below to make the comparison repeatable instead of judging a VPN by one lucky speed-test run.
Research and source check: August 6, 2026. Reviews Ally may earn a commission when you use some links on our site, but providers did not control the measurements or conclusions on this page. Read our advertising disclosure.
Privacy-preserving calculator
Calculate your VPN speed loss in your browser
This calculator does not run a network speed test. First measure your connection with the VPN disconnected, then repeat the measurement with the VPN connected. You can use the Speedtest by Ookla, GFiber speed test, FAST.com, or another tester you trust; keep the same testing method for both sides of the comparison.
Your VPN-on result beat the baseline in at least one throughput field. That can happen in a measurement, but repeat the paired test before crediting the VPN: route choice, Wi-Fi variation, congestion, test-server behavior, and other network conditions can move a single run.
The formulas are visible on purpose
Speed loss
((baseline − VPN) ÷ baseline) × 100. A 500 Mbps baseline and 400 Mbps VPN result equals 20% loss.
Speed retention
(VPN ÷ baseline) × 100. The same 500-to-400 example retains 80% of baseline throughput.
Latency & jitter
VPN value − baseline value. We show ping in milliseconds first because the absolute delay is usually easier to interpret than a dramatic-looking percentage.
Packet loss
VPN loss % − baseline loss %, reported in percentage points. A move from 0.2% to 1.0% is +0.8 pp, not “0.8% slower.”
Repeatable home method
How to test VPN speed without fooling yourself
A useful VPN speed test is a comparison, not a standalone number. The goal is to change the VPN state while keeping as much of the rest of the test as practical the same. For an at-home check, we recommend at least three baseline runs and three VPN-on runs for the condition you care about, then comparing the medians. Three is not magic; it is simply a practical minimum that makes one odd run less powerful.
- Stabilize the setup. Use the same device, connection type, physical position if you are on Wi-Fi, and roughly the same time window. Pause deliberate heavy downloads and uploads.
- Run the no-VPN baseline. Disconnect the VPN and record at least three results. Keep download, upload, and ping; add jitter and packet loss when your test tool reports them.
- Connect the VPN condition you want to study. Record the server or route and the protocol or automatic mode. Disable split tunneling for a general VPN benchmark, or use our split-tunneling test to confirm that the speed-test app is actually on the VPN route. If you change the server, route, or protocol later, treat that as a new condition.
- Repeat the VPN-on runs. Use the same speed-test service. If your goal is to isolate VPN impact, keep the speed-test endpoint fixed when the tool allows it; if you use automatic endpoint selection, record that choice because the endpoint can change.
- Compare representative values. For a simple home test, use the median baseline and median VPN result rather than cherry-picking the best run from either side.
- Repeat before blaming or praising the VPN. If the result surprises you, run the pair again. A transient ISP, Wi-Fi, VPN-server, or test-server event can be louder than the thing you intended to measure.
If you switch from Wi-Fi to cable, from one laptop to another, or from one speed-test service to another, label it as a new series. Faster is nice; comparability is nicer.
Reading the result
Speed loss is useful only when the baseline makes sense
VPN speed loss answers a narrow question: how much lower was the measured throughput with the VPN than without it under the conditions you tested? It is not a direct measurement of encryption cost alone. The observed difference can also contain VPN-server load, routing, protocol behavior, Wi-Fi variance, the speed-test endpoint, congestion, device limits, and ordinary measurement noise.
Do not turn one percentage into a universal grade
There is no defensible fixed rule that makes every 10%, 20%, or 30% loss universally “good” or “bad.” A 40% loss on a gigabit-class line can still leave several hundred Mbps of practical throughput; a smaller percentage loss on a much slower baseline may leave less headroom. Latency, jitter, packet loss, server distance, and what you actually do online matter too.
The calculator therefore reports the measured change instead of assigning a red/yellow/green VPN quality score. If the VPN result is higher than the baseline, it reports a gain rather than a negative loss and asks you to repeat the pair before making a causal claim.
Beyond Mbps
Download, upload, ping, jitter, and packet loss answer different questions
A single “speed” number hides several behaviors. GFiber’s own speed-test guidance describes ping as response time and jitter as variation in that timing, while download and upload measure transfer performance in opposite directions. The metric that matters most depends on the job.
| Metric | What it tells you | Usually matters most for | Main trap |
|---|---|---|---|
| Download | How quickly data reached your device in the test. | Large downloads, high-bitrate streaming, updates, general throughput. | Raw Mbps without the baseline can make a fast underlying connection look like a fast VPN. |
| Upload | How quickly data left your device. | Cloud backups, file sharing, creator uploads, video calls. | Ignoring upload because download is the bigger headline number. |
| Ping / latency | How long a round trip or response takes, reported in milliseconds. | Gaming, remote desktops, interactive apps, voice/video responsiveness. | Comparing a nearby route with a far-away route as though geography had not changed. |
| Jitter | How much latency/timing varies during the measurement. | Calls, live audio/video, interactive traffic. | Treating a single jitter reading as a permanent property of the VPN. |
| Packet loss | The share of packets that did not arrive successfully in the measured flow. | Calls, games, streams, connections that feel unstable despite adequate Mbps. | Calling packet loss “speed loss.” They are different measurements. |
Metric definitions and UI vary by test service. When comparing results, keep the same tool and record which fields it actually reported rather than inventing a missing zero.
Measurement reality
One speed-test result can be technically real and still be unrepresentative
Internet paths are moving targets. Wi-Fi interference, device load, local ISP congestion, VPN-server demand, the route between networks, the selected speed-test server, and protocol behavior can all change the result. GFiber explicitly notes that Wi-Fi and device conditions can affect test performance; FAST.com likewise presents its result as an estimate rather than a service certification.
Use a median for a home test
With three or more comparable runs, the median reduces the influence of one unusually high or low result without pretending the network stopped varying.
Keep conditions paired
A baseline from Monday on Ethernet is not a clean control for a VPN test on Friday over crowded Wi-Fi. Pair the measurements closely when possible.
Label automatic choices
Automatic VPN modes and automatic speed-test servers are legitimate real-world settings, but they can change what path you are measuring. Record them.
Investigate gains too
A VPN-on result above baseline is not impossible as a measurement. It is also not automatic proof that encryption made the line faster. Repeat it and look for routing or baseline variance.
First-party test example
A real CyberGhost VPN pair from our June test cycle
Here is the calculation using one documented provider session, not a hypothetical. Our CyberGhost VPN review recorded 11 no-VPN baseline runs in the same cable-based session and two standard WireGuard runs on the Miami route. The baseline average was 903.9 Mbps down, 55.4 Mbps up, and 13.3 ms ping. The two Miami runs averaged 465.9 Mbps down, 41.9 Mbps up, and 136.5 ms ping.
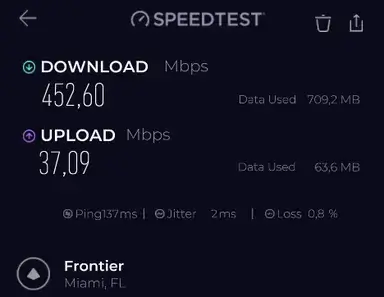
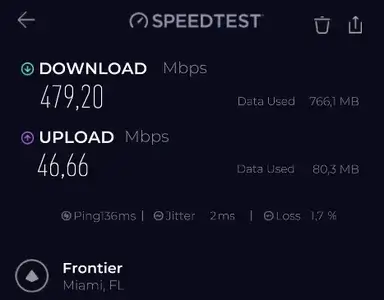
| Measure | No-VPN baseline avg. | Miami VPN avg. | Calculated change |
|---|---|---|---|
| Download | 903.9 Mbps | 465.9 Mbps | 48.5% loss; 51.5% retained |
| Upload | 55.4 Mbps | 41.9 Mbps | 24.4% loss; 75.6% retained |
| Ping | 13.3 ms | 136.5 ms | +123.2 ms |
| Jitter | 3.9 ms | 2.0 ms | −1.9 ms |
| Packet loss | 0.0% | 1.25% | +1.25 percentage points |
This is an example of the math and the recorded environment, not a claim that CyberGhost will always lose 48.5% of download speed. We publish the VPN-on screenshots but not the exact home/baseline-location screenshot. See the full CyberGhost VPN review for the broader findings.
Route context
Nearby and distant VPN servers are different tests
A nearby route is useful when you want the best everyday performance. A distant route is useful when you actually need that geography. Longer physical and network paths often add latency, but distance is not destiny: peering, congestion, VPN-server capacity, protocol choice, and where the speed-test endpoint sits can all change the observed result.
Do not average a nearby Miami-style use case and a very distant route into one number and then call that number “the VPN’s speed” without context. Compare like with like: nearby against nearby, or the same destination across providers. If you care about a particular country, test that country.
Protocol effect
The VPN protocol can change the result dramatically
Protocol is another variable worth isolating. In our current paid protocol subset, the WireGuard/WireGuard-derived option produced higher download throughput than the comparable OpenVPN result in all seven providers where we had a usable same-session pairing. In the five providers with direct OpenVPN UDP versus TCP pairs, UDP produced higher download throughput in all five. Those are observations from this test cycle, not universal laws.
If Automatic mode is your normal setting, test it as Automatic. If you are troubleshooting, change one protocol at a time and rerun the pair. Our VPN Protocols Compared guide explains the 65-record protocol dataset, WireGuard/OpenVPN boundaries, TCP versus UDP, provider-specific modes, and the limitations behind those comparisons.
When the result looks wrong
Troubleshoot the comparison before you troubleshoot everything
If the VPN suddenly looks much slower than expected, first check whether the baseline is healthy. Then change one variable at a time. Turning five knobs at once may produce a faster number, but it also destroys the explanation for why.
| What you see | Check next | Why |
|---|---|---|
| Baseline is slow too | Retest the local connection, Wi-Fi/cable, device load, and ISP path before blaming the VPN. | The VPN cannot be isolated if the control is already unstable. |
| One VPN run is much slower | Repeat the same server and protocol. | A single transient result is weak evidence. |
| Nearby server is unexpectedly poor | Try another nearby server, then compare under the same protocol. | Server load and routing can matter more than a country label. |
| Good Mbps but calls/games feel bad | Look at ping, jitter, and packet loss rather than download alone. | Interactive traffic cares about timing and stability. |
| Automatic mode is inconsistent | Record what Automatic selects if the app reveals it, then test a manual protocol. | The app may be changing the variable you thought was fixed. |
| Different tools disagree | Treat them as separate series; repeat each tool consistently. | Test endpoints and measurement methods differ. |
Do not disable your firewall, endpoint security, or other important protections merely to chase a benchmark number. If a VPN only looks good after removing the controls you actually use, that benchmark has answered the wrong question.
Downloadable first-party evidence
Explore our sanitized 268-row VPN speed dataset
The public CSV contains every authentic row in the consolidated speed dataset behind the current nine-provider cycle: 86 no-VPN baselines, 117 standard VPN-route measurements, and 65 protocol-comparison measurements. Ping, download, and upload are present in all 268 rows. Jitter is missing in 52 rows and packet loss in 73; those cells stay blank rather than being rewritten as zero.
Download the 268-row speed-test CSV
Provider coverage
| Provider | Test period | Baseline | Standard routes | Protocol comparison | Total |
|---|---|---|---|---|---|
| NordVPN | May 2026 | 4 | 8 | 3 | 15 |
| Surfshark | June 2026 | 13 | 16 | 6 | 35 |
| Proton VPN | June 2026 | 12 | 14 | 10 | 36 |
| Private Internet Access | May 2026 | 9 | 12 | 6 | 27 |
| CyberGhost VPN | June 2026 | 11 | 14 | 8 | 33 |
| PureVPN | May 2026 | 9 | 5 | 4 | 18 |
| PrivateVPN | July 2026 | 12 | 16 | 6 | 34 |
| VPN.ac | July 2026 | 9 | 12 | 14 | 35 |
| Turbo VPN | July 2026 | 7 | 20 | 8 | 35 |
Public CSV data dictionary
| Field | Meaning |
|---|---|
provider | VPN provider tested. |
record_type | baseline, standard_vpn_route, or protocol_comparison. |
run_group | Recorded test group within that provider/session context. |
vpn_enabled | Whether the measurement was taken with the VPN connected. |
vpn_server_location | VPN route/location for VPN-on records; intentionally blank for baseline rows. |
protocol_or_mode | Recorded VPN protocol, transport, Automatic/Smart state, or provider-specific mode where documented; blank for baseline rows. |
ping_ms | Recorded ping in milliseconds. |
download_mbps | Recorded download throughput in Mbps. |
upload_mbps | Recorded upload throughput in Mbps. |
packet_loss_pct | Recorded packet loss percentage when captured; blank means missing, not 0%. |
jitter_ms | Recorded jitter in milliseconds when captured; blank means missing. |
connection_type | Wi-Fi or cable when it was documented cleanly for that research session; otherwise blank. |
test_period | Generalized review month and year, not an exact timestamp. |
What we removed before publishing
Privacy and auditability can coexist. The public file excludes the tester’s exact home/baseline location, real public IP, exact timestamps, raw internal notes, data-consumption fields that are not needed for this analysis, source filenames, account or billing details, and other internal research identifiers. Baseline server/location fields are deliberately blank. VPN server locations remain because the tested VPN route is necessary to interpret a VPN-on speed result.
How ReviewsAlly uses the measurements
Our current ranking method is stricter than a single home comparison
The simple at-home method above recommends medians across repeated paired runs. Our current ReviewsAlly provider comparison has a different historical structure because it was built across a real editorial test cycle: for each provider, we average the recorded no-VPN baseline values for that review session; when a ranked VPN route has repeated runs, we average those runs; then we use the median across the provider’s ranked routes for download and upload retention.
The current Best Picks speed index weights median download retention at 65%, practical throughput at 25%, and median upload retention at 10%. The practical-throughput component is median route download divided by 300 Mbps and capped at 100 points. Differences below one index point are treated as technical ties and resolved by evidence completeness/repeatability before practical throughput. Ping and packet loss can change the written caution but are not forced into the universal formula because route conditions and field completeness differ.
See How We Test VPNs for the full evidence method and our current nine-provider speed ranking for the provider-level result. This page owns the reader task of measuring and interpreting speed loss; the Best Picks remains the owner of the provider ranking.
What this evidence can and cannot prove
Our first cycle is real-world evidence, not a permanent global lab
Our first paid VPN test cycle became more structured as we completed it, so earlier reviews sometimes have fewer route repeats or secondary fields than later reviews. We preserve the measurements that exist, keep missing fields missing, and call out lower repeat depth where it affects confidence. Every provider’s speed-testing session still took hours of hands-on work; a smaller early repeat count does not turn a real recorded test into invented data.
More resources would let us add more devices, access networks, countries, time windows, and recurring retests. That would broaden the benchmark, not change the integrity of the measurements already recorded. The current cycle describes a Latin America-based consumer environment with Windows 10 as the primary desktop platform and Wi-Fi or cable according to the recorded session. It does not guarantee what a different household, ISP, device, VPN server, protocol, or future app version will see.
NordVPN and PureVPN came earlier in the cycle and have fewer repeats than several later providers. We do not erase those tests or pretend they have later-cycle repetition depth. Likewise, we do not backfill jitter or packet loss from screenshots after the fact when the consolidated research row did not record the field.
Sources & tools
Sources used for this VPN speed guide
The first-party calculations come from our paid VPN evidence logs, final dictated research, safe-to-publish screenshots, and consolidated speed dataset. External sources below explain the measurement tools or general metric behavior; competitor VPN articles were not used as the factual authority for our recorded results.
ReviewsAlly first-party evidence
Measurement tools & metric references
- Speedtest by Ookla for Windows — the application used for the current ReviewsAlly recorded speed cycle.
- GFiber Internet Speed Test — current explanations of ping, jitter, download, upload, and factors that affect a test.
- FAST.com by Netflix — a separate consumer speed tool showing download plus optional upload/latency information.
- Measurement Lab NDT — an open measurement alternative. Its page explicitly asks users to agree to a data policy that includes retention and publication of IP addresses, so review that policy before using it.
Hands-on speed cycle: May–July 2026. Source and methodology recheck: August 6, 2026. External editorial citations are normal follow links; they are not affiliate links.
Common questions
VPN speed test FAQ
How much VPN speed loss is normal?
There is no universal percentage that is “normal” for every connection. Baseline capacity, server distance, protocol, congestion, device, network type, VPN-server load, and the speed-test endpoint all matter. Compare your VPN against a representative baseline and ask whether the remaining throughput and latency meet your actual use case instead of relying on a fixed grade.
Can a VPN make a speed test faster?
A VPN-on measurement can be higher than a baseline measurement. That does not prove the VPN itself created extra bandwidth. Routing differences, baseline variance, Wi-Fi conditions, congestion, or how an ISP handles a path can change the result. Our calculator reports a measured gain when it occurs, then recommends repeating the pair before making a causal claim.
How many VPN speed tests should I run?
For a practical home comparison, we recommend at least three no-VPN runs and three VPN-on runs under similar conditions, then comparing the medians. More runs can improve confidence when results are noisy. ReviewsAlly’s current editorial dataset has different repeat depth by provider because the first paid cycle became more structured over time, and we disclose that difference rather than pretending every session was identical.
Should I use the same speed-test server with and without the VPN?
If your goal is to isolate the VPN’s effect as tightly as practical, yes: keep the same speed-test service and endpoint when the tool lets you select it. If your goal is the practical “automatic” experience, allowing automatic server selection can also be valid, but record that choice because the selected endpoint may change when the VPN changes your apparent location.
Is ping more important than download speed?
It depends on the task. Download throughput matters more for large transfers and high-bitrate consumption. Ping, jitter, and packet loss can matter more for games, remote desktops, voice, and live calls. Upload matters for backups, file sharing, calls, and creator workflows. A VPN can therefore look fast in Mbps and still feel poor in an interactive workload.
Is VPN speed loss the same as VPN overhead?
No. Speed loss is the observed difference between your baseline and VPN-on throughput. Protocol encapsulation and encryption contribute overhead, but the measured difference can also include server load, route changes, congestion, test-server behavior, device limitations, and ordinary network variance. A speed-loss percentage is not a laboratory isolation of protocol overhead.
Does the ReviewsAlly calculator collect my speed-test values?
No. The calculator code performs the arithmetic locally in the page. It does not make calculator API requests, upload your entered measurements, use localStorage/sessionStorage, set calculator cookies, or store results. If you open an external speed-test service, that separate service has its own privacy and data-handling policy.